Neuropulse Super Bowl LV Ad Report
Methodology
What we measured.
Participants wore bands that measured neurological indicators, including the variance in cardiac rhythm. Data was collected over the course of the Super Bowl broadcast. Neurological data collected was translated into levels of immersion and psychological safety to identify the most and least successful ads.
![]() Awesome Index
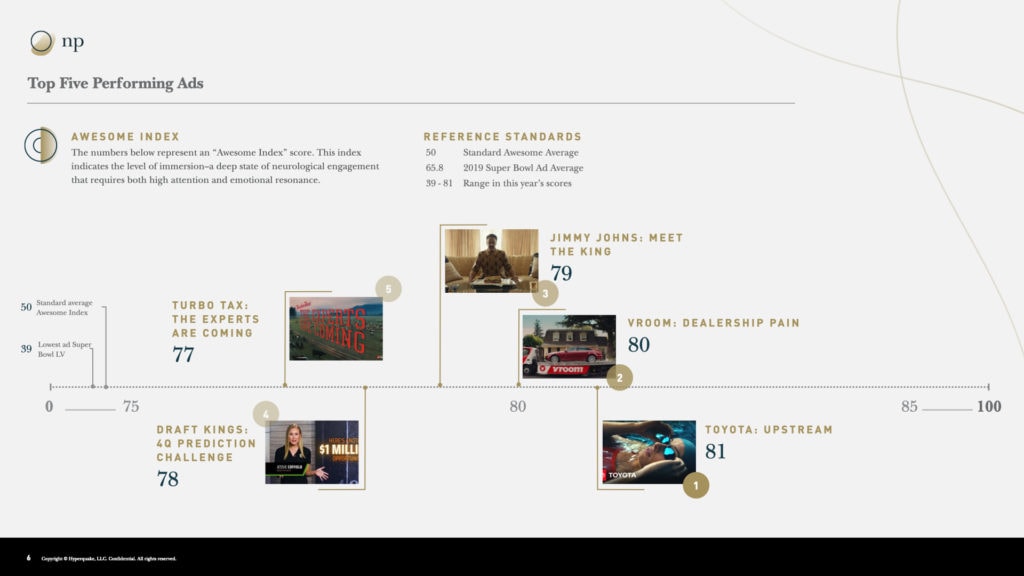
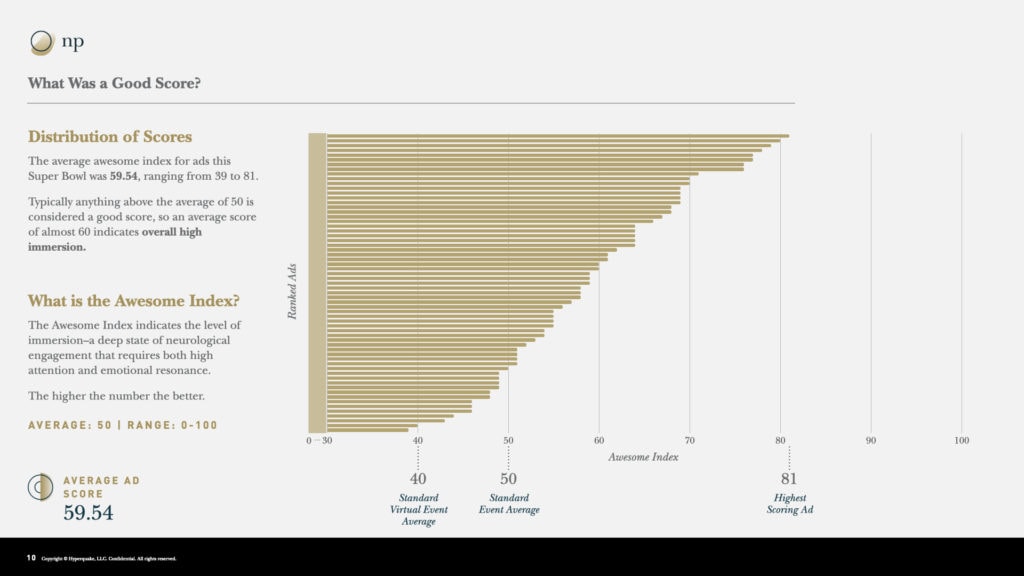
Awesome Index
Indicates the level of immersion–a deep state of neurological engagement that requires both high attention and emotional resonance. The higher the number the better. | Average = 50, Range = 0-100
![]() Wow Factor
Wow Factor
Identifies sustained points of deep immersion in experiences that drive enjoyment and higher likelihood of retention. The higher the score the better. Range 1-10
![]() Super Fans
Super Fans
People who are most immersed in the experience and will share it with others. Number individuals with Super-fan level scores. The more, the better.
![]() Blah Factor
Blah Factor
Identifies points of confusion, negative emotion, or simply boredom (ie content not resonating) in experiences that lead to disengagement. The lower the score the better. Range 1-10
![]()
Psychological Safety Identifies readiness to learn and willingness to take in new information. The higher the score the better. Range 1-10.
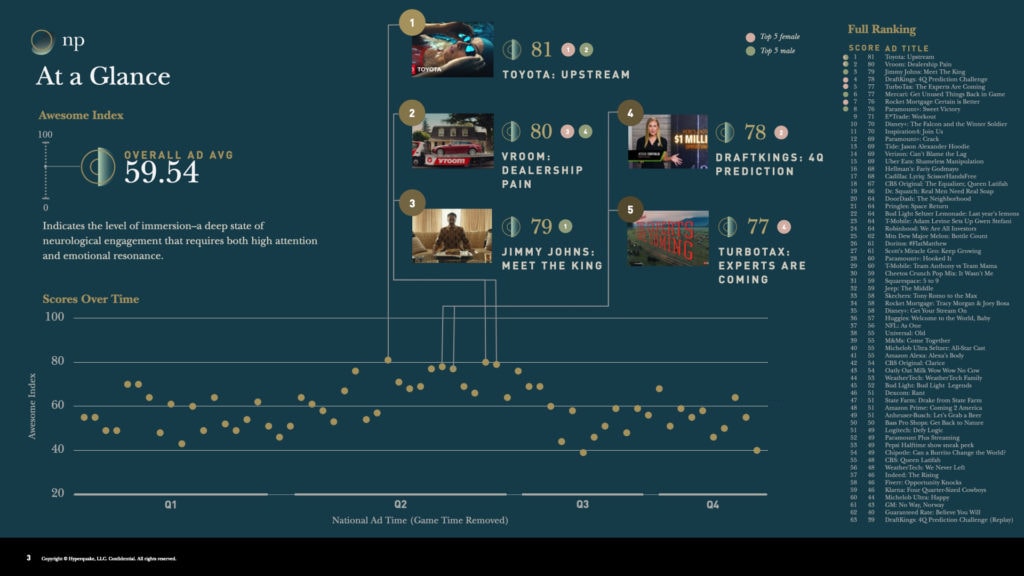
The Winner

power of storytelling
The shape of the immersion data matches the story. Immersion builds to a peak mid-spot as the story is revealed, immersion dips during a break in the voice-over and rises to a final peak as the story is resolved.
importance of brand timing
There are two moments the Toyota brand is shown: at the finish line of the race and the end of the ad. While the entire ad elicited high immersion, immersion dipped at both key branding moments. The data pattern suggests that people will remember the ad, but are less likely to attribute it to Toyota than if branding occurred at relatively higher immersion moments.
The Top 5
Male vs. Female Comparison
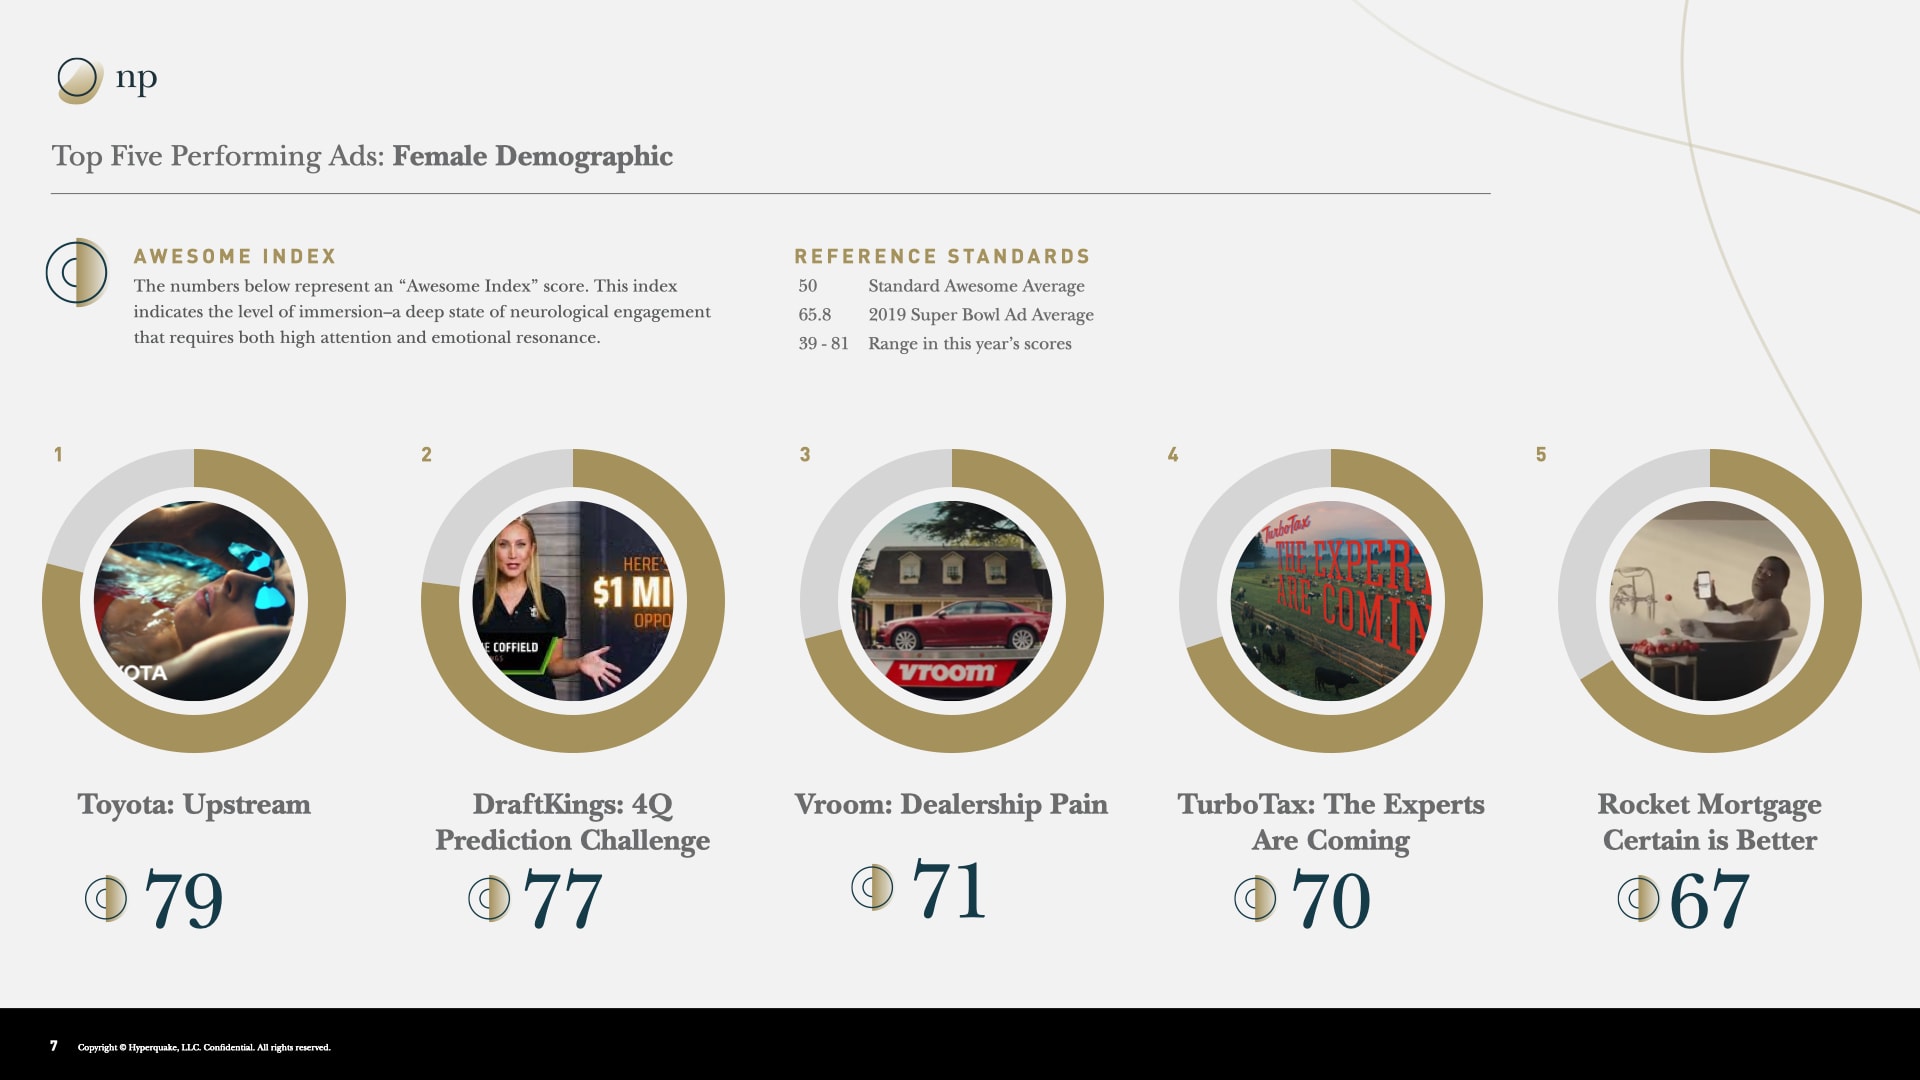
Top Five Performing Ads: Female Demographic
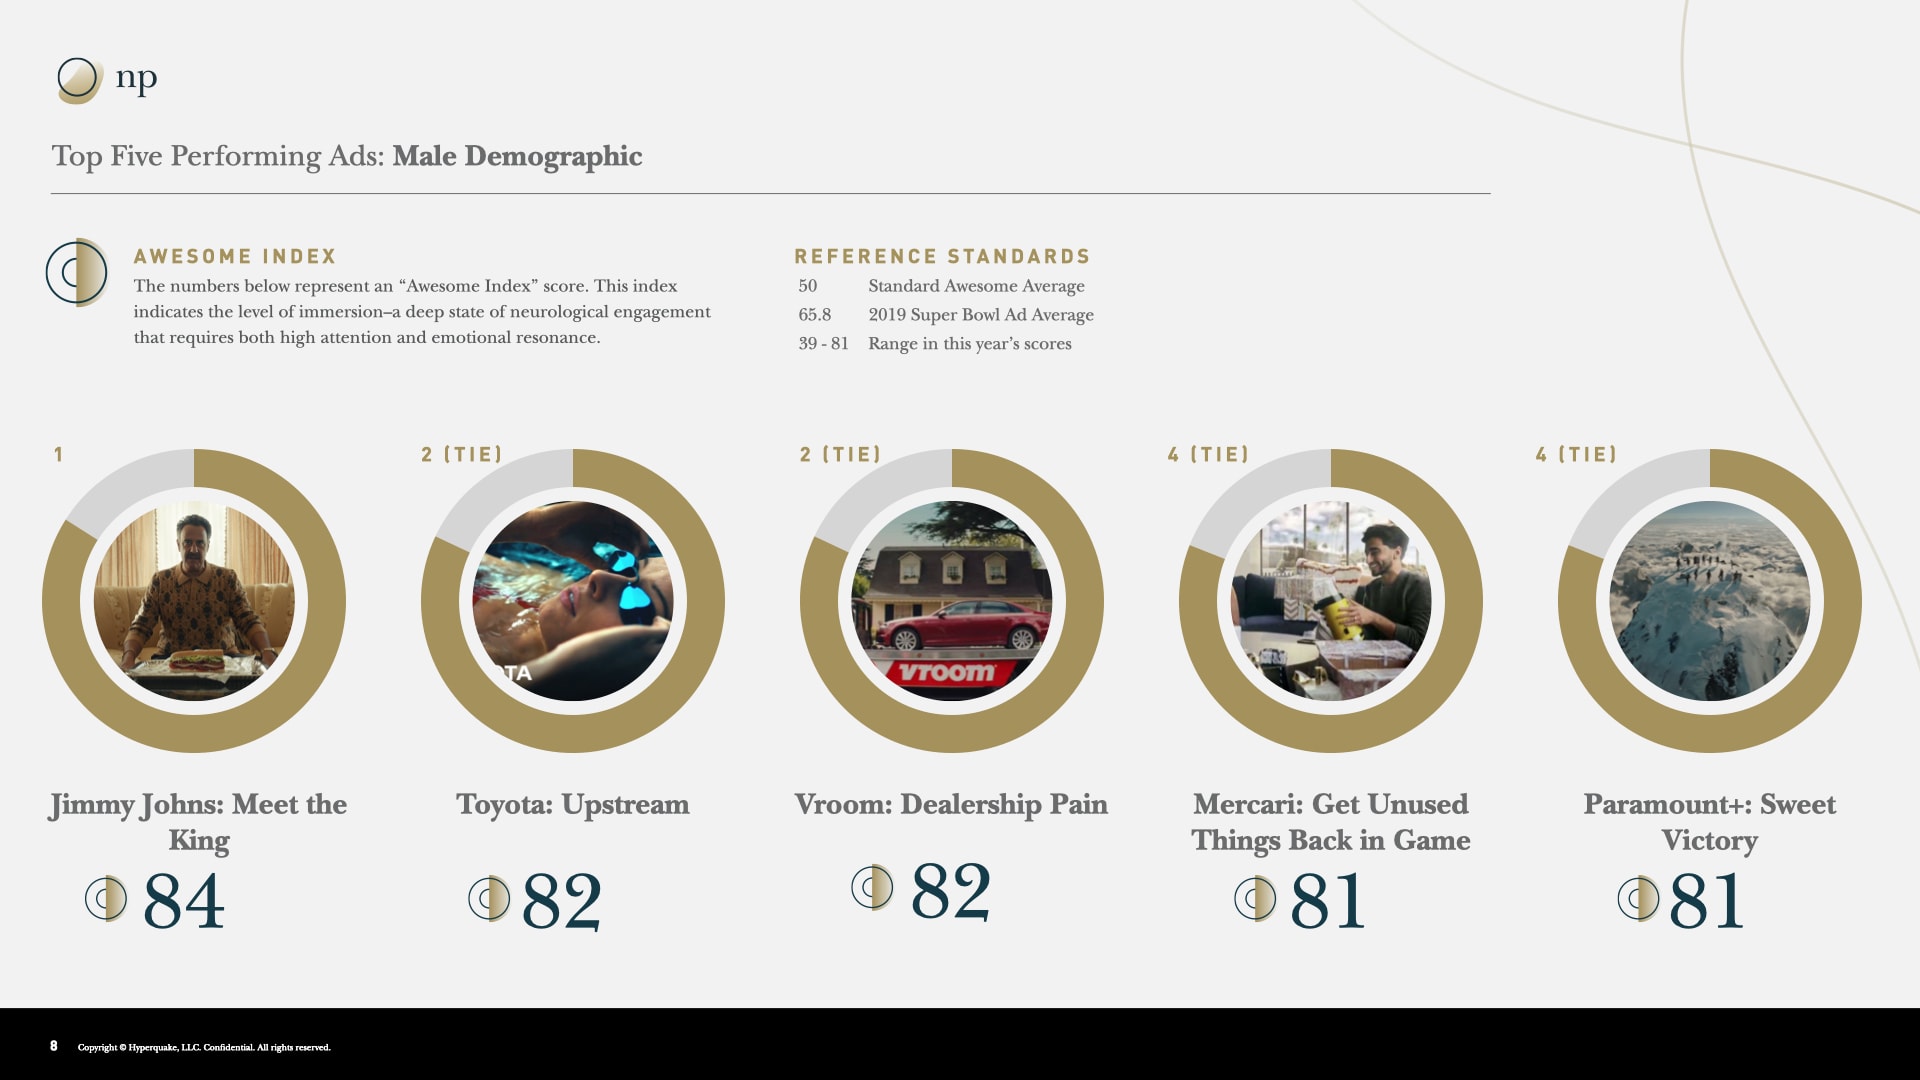
Top Five Performing Ads: Male Demographic
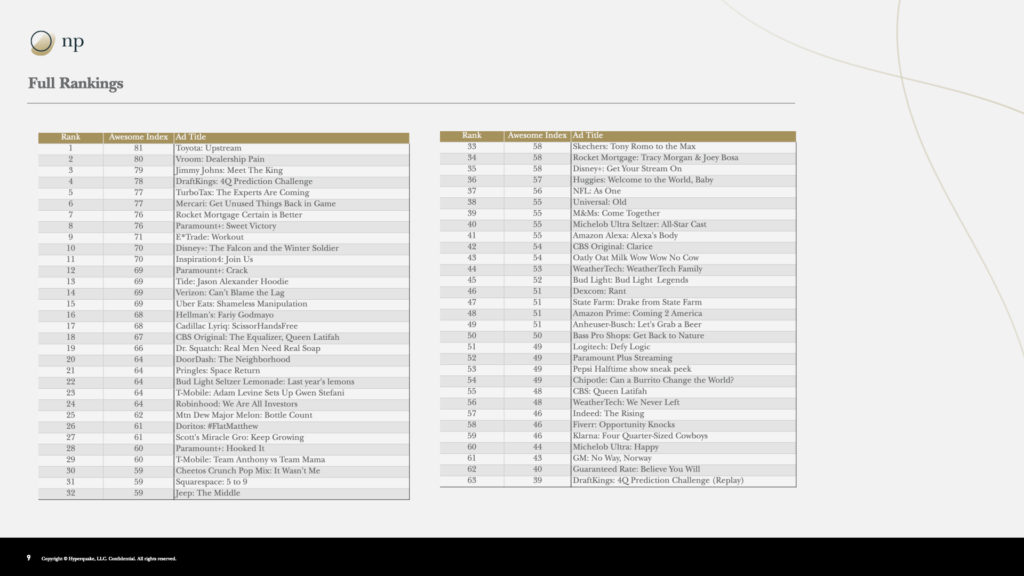
Full Rankings
Conclusions
not celebrity nor showcase
Toyota’s Super Bowl LV spot wasn’t the winner because of how many times they mentioned their brand name or showed you how cool their car looked – or even because people said they liked it. According to the Neuropulse results captured through Immersion, it won because it triggered a biological response that kept people emotionally engaged for longer periods of time than any other commercial.
Toyota chose to share a human experience with the audience
The brain found value in what the Toyota commercial was sharing and it wants you to remember and trust it. Toyota chose to share an emotional connection with the Super Bowl LV audience, not just rational reasons to buy a car; it gave you a glimpse into what truly motivates the company to keep making cars, the human spirit.
The car game is finite, moving people is infinite
Toyota also knows that the car game is finite, but moving people whether emotionally or truly physically is infinite. It’s time for brands to shift their thinking beyond the short game and embrace a stronger sense of purpose, set a vision beyond numbers, and start connecting it to the shared values of the people they serve – because when they do that, we all win.
What was a good score?
Best Practices
general notes
- We require 32 participants for statistically significant results. We suggest 35 participants to ensure complete data throughout the event. Results from smaller groups can be an indicator of trends.
- Neurological data collected are translated into levels of immersion, wow factor, blah factor, and psychological readiness to identify the most and least successful segments of the event.
- We can compare Neuropulse results to survey or focus group answers and overlay additional insights.
key analysis opportunities
- Overall flow and Pulsepoint (segment) comparison: We begin by looking at the event as a whole to see the overall trends in immersion and compare one section to another.
- Sections comparison and tagging analysis: We compare other section breakdowns of the experience, such as speakers, videos, interviews, and interactive components, to see which section are most and least immersive.
- Detailed Pulsepoint review: We take a closer look at individual segments of interest to see the precise moments where something went right or wrong.
- Demographic comparison: For the whole event or sections of the event, we compare how different groups of people reacted. We can break down by any demographic information provided (gender, title, department, etc.).